The far right in the U.S. has been desperately trying to convince the electorate that President Obama is spending the U.S. into oblivion and driving up the debt.
Here are the facts…
The Washington Post and Center on Budget and Policy Priorities compiled this chart:
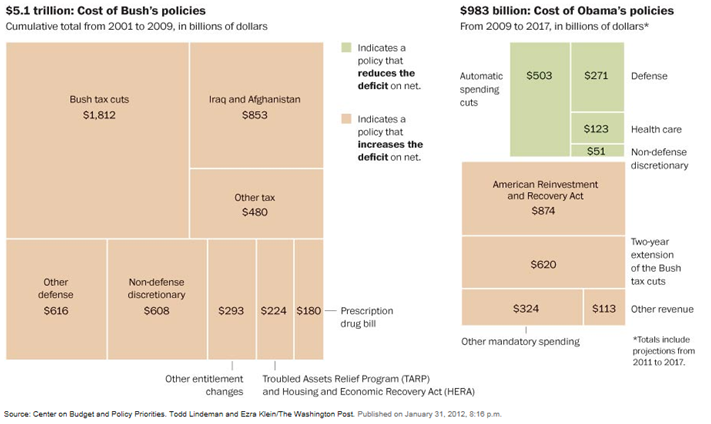
This chart shows the debt directly attributed to President Bush and President Obama. Much of the recent debt came from the Bush tax cuts.
Let’s look into the debt further…
This blog post states the following:
During 20 years of the presidencies of Reagan, Bush I and Bush II, the federal debt as a share of GDP increased by a cumulative 43% of GDP. During the 4 first years of the Obama presidency, it has increased by 36% of GDP.
This is how the Presidents rank in terms of development of the Debt/GDP ratio per year of tenure:
1. Clinton -1% per year
2. Reagan, Bush II: +2% per year
3. Bush I: +3% per year
4. Obama: +9% per year.
This following data comes from this (xls) Office of Management and Budget (OMB) source:
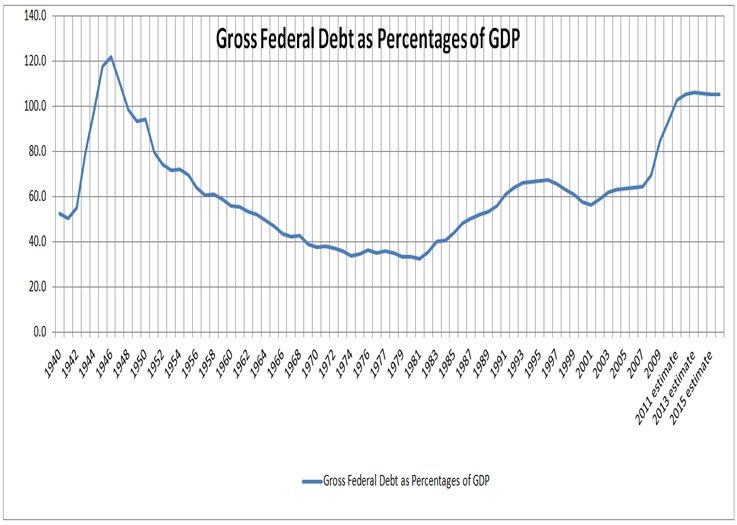
I re-plotted the data since, you could say, I have trust issues on the internet. It is similar to the data in the post.
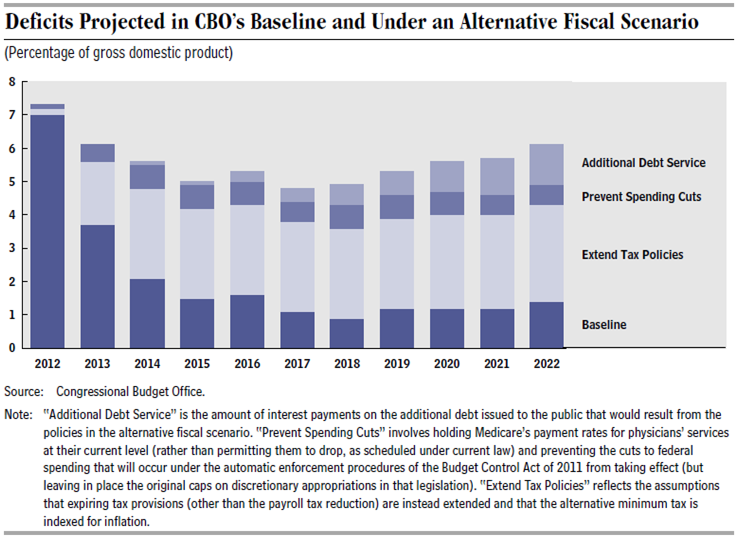
The following is “The Budget and Economic Outlook: Fiscal Years 2012 to 2022” from the Congressional Budget Office.
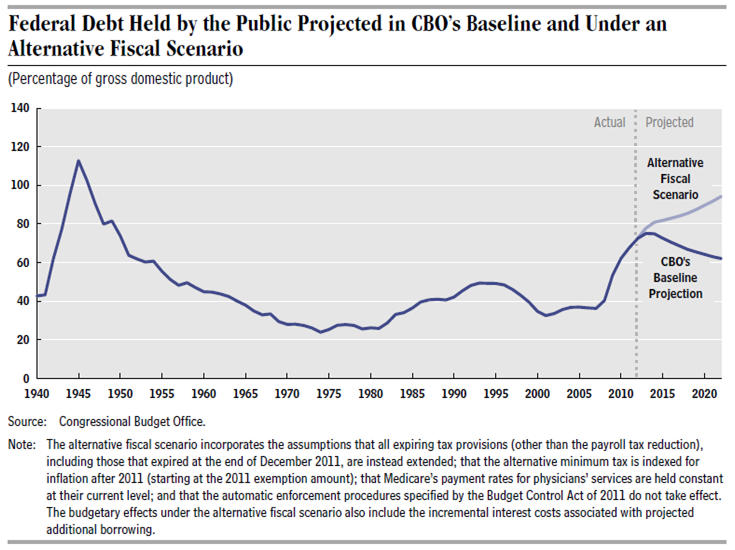
What the blog post above did not state is that the historical years since the Bush tax cuts and the recession that started prior to President Obama taking office, have been the major contributors to the rise in spending as a percentage of GDP. Also, the future years the OMB graph shows is a worst case scenario that includes the CBO Alternative Fiscal Scenario which assumes the Bush tax cuts are extended. President Obama did not create the recession, he inherited it. The Bush tax cuts were not enacted into law by President Obama. It is a lie to blame the recession and the Bush tax cuts on President Obama.
Let’s dig down a little more.
This following is historical and projected outlays from The Office and Management Budget by agency. Outlays are the total amount of money spent including authority from prior years that obligates outlays in the current year. The source data from the following charts comes from this (xls) OMB data. The data lines and the legend descriptions are in the same order. My graphics file can be downloaded here (xls). This chart shows that the Federal debt has accumulated from previous years going back to 1962.
OUTLAYS BY AGENCY: 1962–2017
(in millions of dollars)
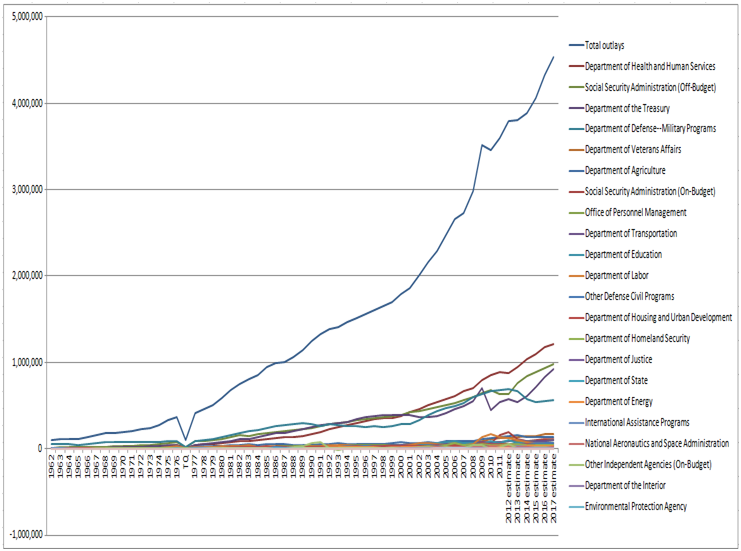
This chart shows that the Federal debt has accumulated from previous years going back to 2000.
OUTLAYS BY AGENCY: 2000–2017
(in millions of dollars)
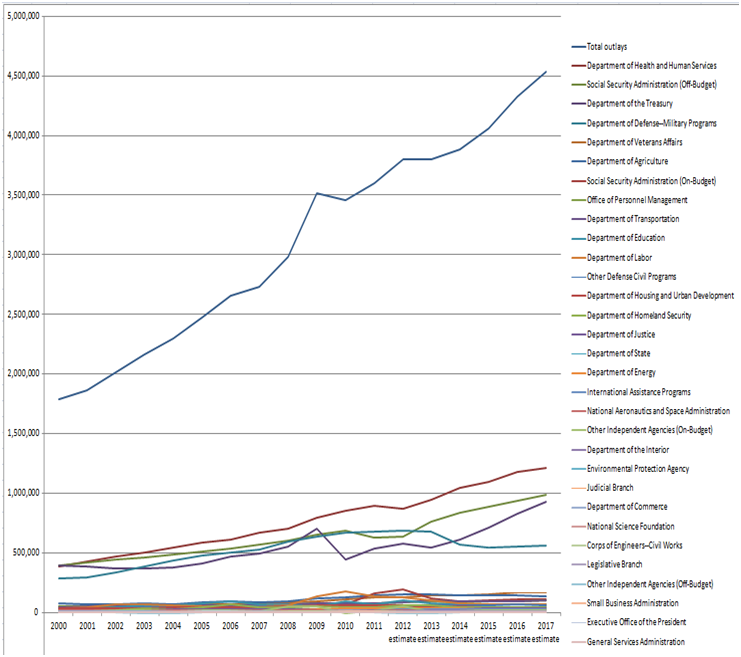
There is no huge increase in spending starting in 2009 when President Obama was inaugurated. The estimates include the Affordable Care Act. The chart shows that all the major increases in spending started ramping up more quickly in the decade of 2000. The spending is chiefly in the Department of Health and Human Services, Social Security Administration (off-budget), Department of Treasury and the Department of Defense (Military Programs). The Department of Health and Human Services increase comes chiefly from the middle class falling closer towards the federal poverty level as discussed below in more detail. The Social Security Administration increases have to do with baby boomers getting older and rising health care costs. The Treasury Department increases come basically from paying interest on the national debt by financing it with government bonds. The Department of Defense increases have to do with the wars in Iraq and Afghanistan and the costs of gearing up for war. It is interesting to note that the U.S. spends 41% of the world’s total military expenditure. China, the next highest in the world’s total military expenditure, only spends 8.2% (see this).
The baseline scenario in the graph below shows current law and the effect of continuing certain programs that are scheduled to expire.
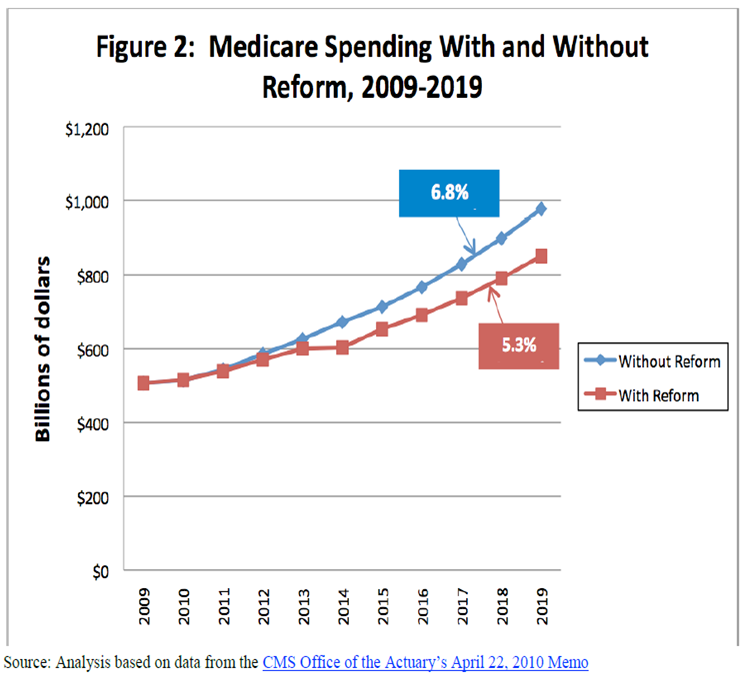
If you really want to raise the debt go ahead and repeal the Affordable Care Act according to the Center for Medicare and Medicaid Service (CMS) according to this publication:
Mandatory budget items are not optional year to year. It takes an act of Congress to change a mandated budget item. These requirements were made by Republicans and Democrats over the years. President Obama did not create the vast majority of mandatory budget requirements. The Affordable Care Act is mandatory but as already shown will lower the debt unless it is repealed. Discretionary budget items are voted on each year by Congress in 13 appropriations bills. Here is a chart showing mandatory and discretionary spending for 2010:
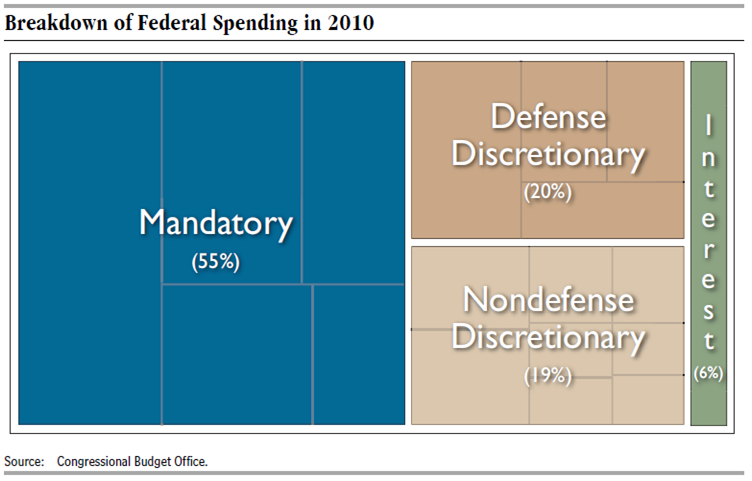
Mandatory and discretionary budget items are further explained in this:
Discretionary spending is provided in, and controlled by, annual appropriations acts, which fund many of the routine activities commonly associated with such federal government functions as running executive branch agencies, congressional offices and agencies, and international operations of the government.1 Essentially all spending on federal wages and salaries is discretionary.
Discretionary spending is often contrasted with mandatory, or direct, spending. Mandatory spending includes federal spending on entitlement programs, the Supplemental Nutrition Assistance Program (formerly known as the Food Stamps program), and other spending controlled by laws other than appropriation acts.3 Spending levels for mandatory programs are generally controlled by eligibility criteria and size of the eligible population.
Mandatory budget items have gone up for some time now as this chart shows:
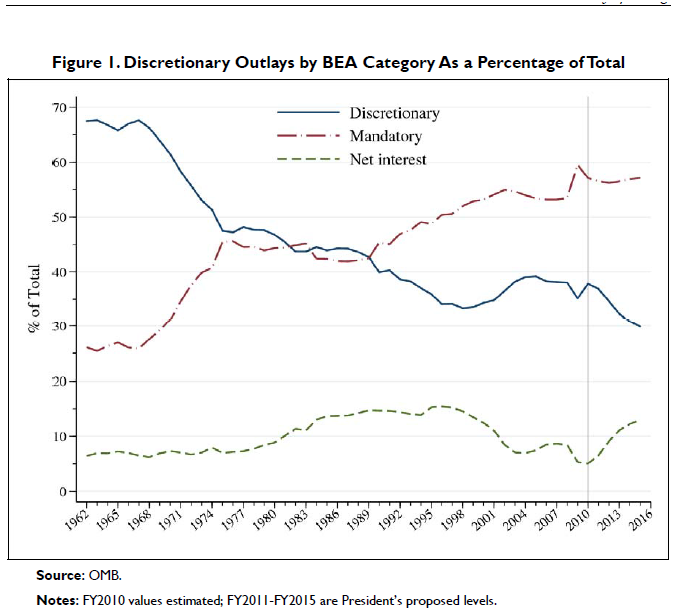
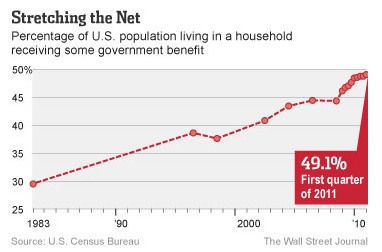
The recession which certainly preceded President Obama has resulted in many more people qualifying for entitlement benefits. President Obama did not change qualification requirements for these programs. As more people fell towards the federal poverty level, more people have received government benefits. This is shown by the Census Bureau and an article in the Wall Street Journal:
All of this data supports the conclusion that President Obama has acted very responsibly in view of the economic catastrophe he inherited. The far right is spinning yet another myth.
Links for further reading:
http://useconomy.about.com/od/fiscalpolicy/p/Mandatory.htm
http://useconomy.about.com/od/fiscalpolicy/tp/US_Federal_Budget.htm
http://www.whitehouse.gov/omb/budget/historicals/
http://useconomy.about.com/od/healthcarereform/f/Patient-Affordable-Care-Act.htm
http://useconomy.about.com/od/candidatesandtheeconomy/f/Healthcare_Reform_and_Budget.htm
http://super-economy.blogspot.com.au/2011/08/obama-hockey-stick.html
http://super-economy.blogspot.com.au/2011/12/american-federal-debt.html
http://www.cbo.gov/publication/21203
http://www.cbpp.org/research/index.cfm?fa=topic&id=121
http://www.gao.gov/special.pubs/longterm/pdfs/spring2012_update_slides.pdf
http://www.cbo.gov/sites/default/files/cbofiles/ftpdocs/108xx/doc10871/01-26-outlook.pdf
http://www.nytimes.com/packages/html/newsgraphics/2011/0119-budget/index.html
http://www.whitehouse.gov/sites/default/files/omb/budget/fy2012/assets/health.pdf
http://www.cbpp.org/cms/index.cfm?fa=view&id=3450
http://www.cbp.org/documents/120224_CalWORKs_KeyFacts.pdf
http://www.kff.org/medicaid/upload/7985.pdf
http://www.ssa.gov/history/BudgetTreatment.html
http://www.epi.org/publication/bp156/
http://www.socialsecurity.gov/history/InternetMyths.html
http://www.nytimes.com/2009/05/13/us/politics/13health.html
http://www.usgovernmentspending.com/year_spending_2012USbn_13bs1n_3031#usgs302
http://www.globalissues.org/article/75/world-military-spending