Here are the latest numbers:
Bush debt increase: 85%
Obama debt increase: 43%
Bush increase in unemployment: 86%
Obama increase in unemployment: 9%
Bottom Line: Anyone that tells you President Obama ran up the debt percentage wise more the President Bush OR that President Obama ran up unemployment percentage wise more than Bush IS A LIAR and here are the numbers and references to absolutely unquestionable sources (Treasury Department and The Bureau of Labor Statistics).*
Please note the the seasonably abjusted unemployment numbers for December was revised downward to 8.5% so don’t let them tell you it was Christmas help.
http://www.bls.gov/news.release/empsit.a.htm
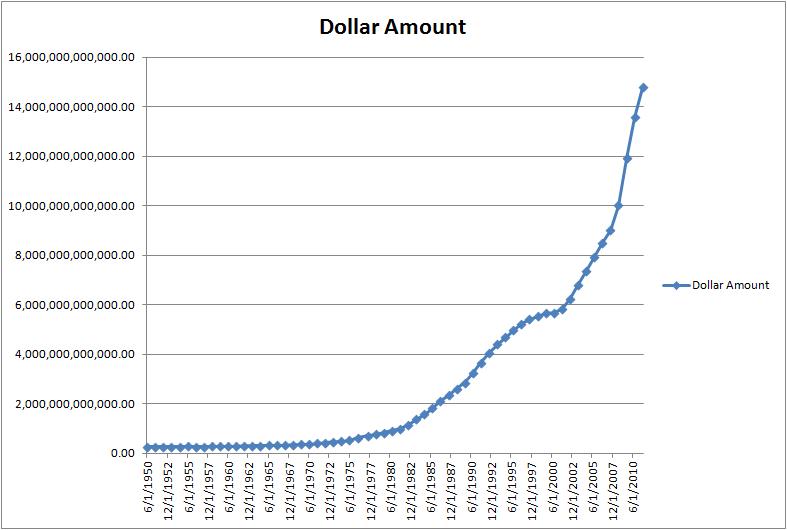
This is a graph of the debt since 1950 (click on the graphs to make them larger)…
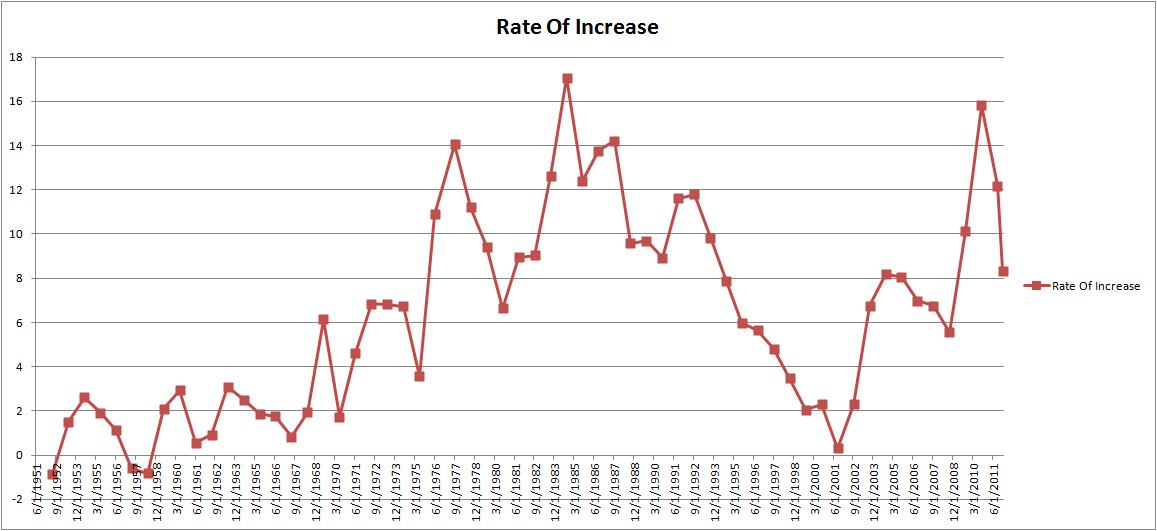
This is the rate of increase of the debt since 1950…
Please note the difference from 2001 to 2009 and 2009 to 2011. This is Bush vs Obama
Note: The graph only uses full fiscal year data. The last fiscal year ended was September 30, 2011
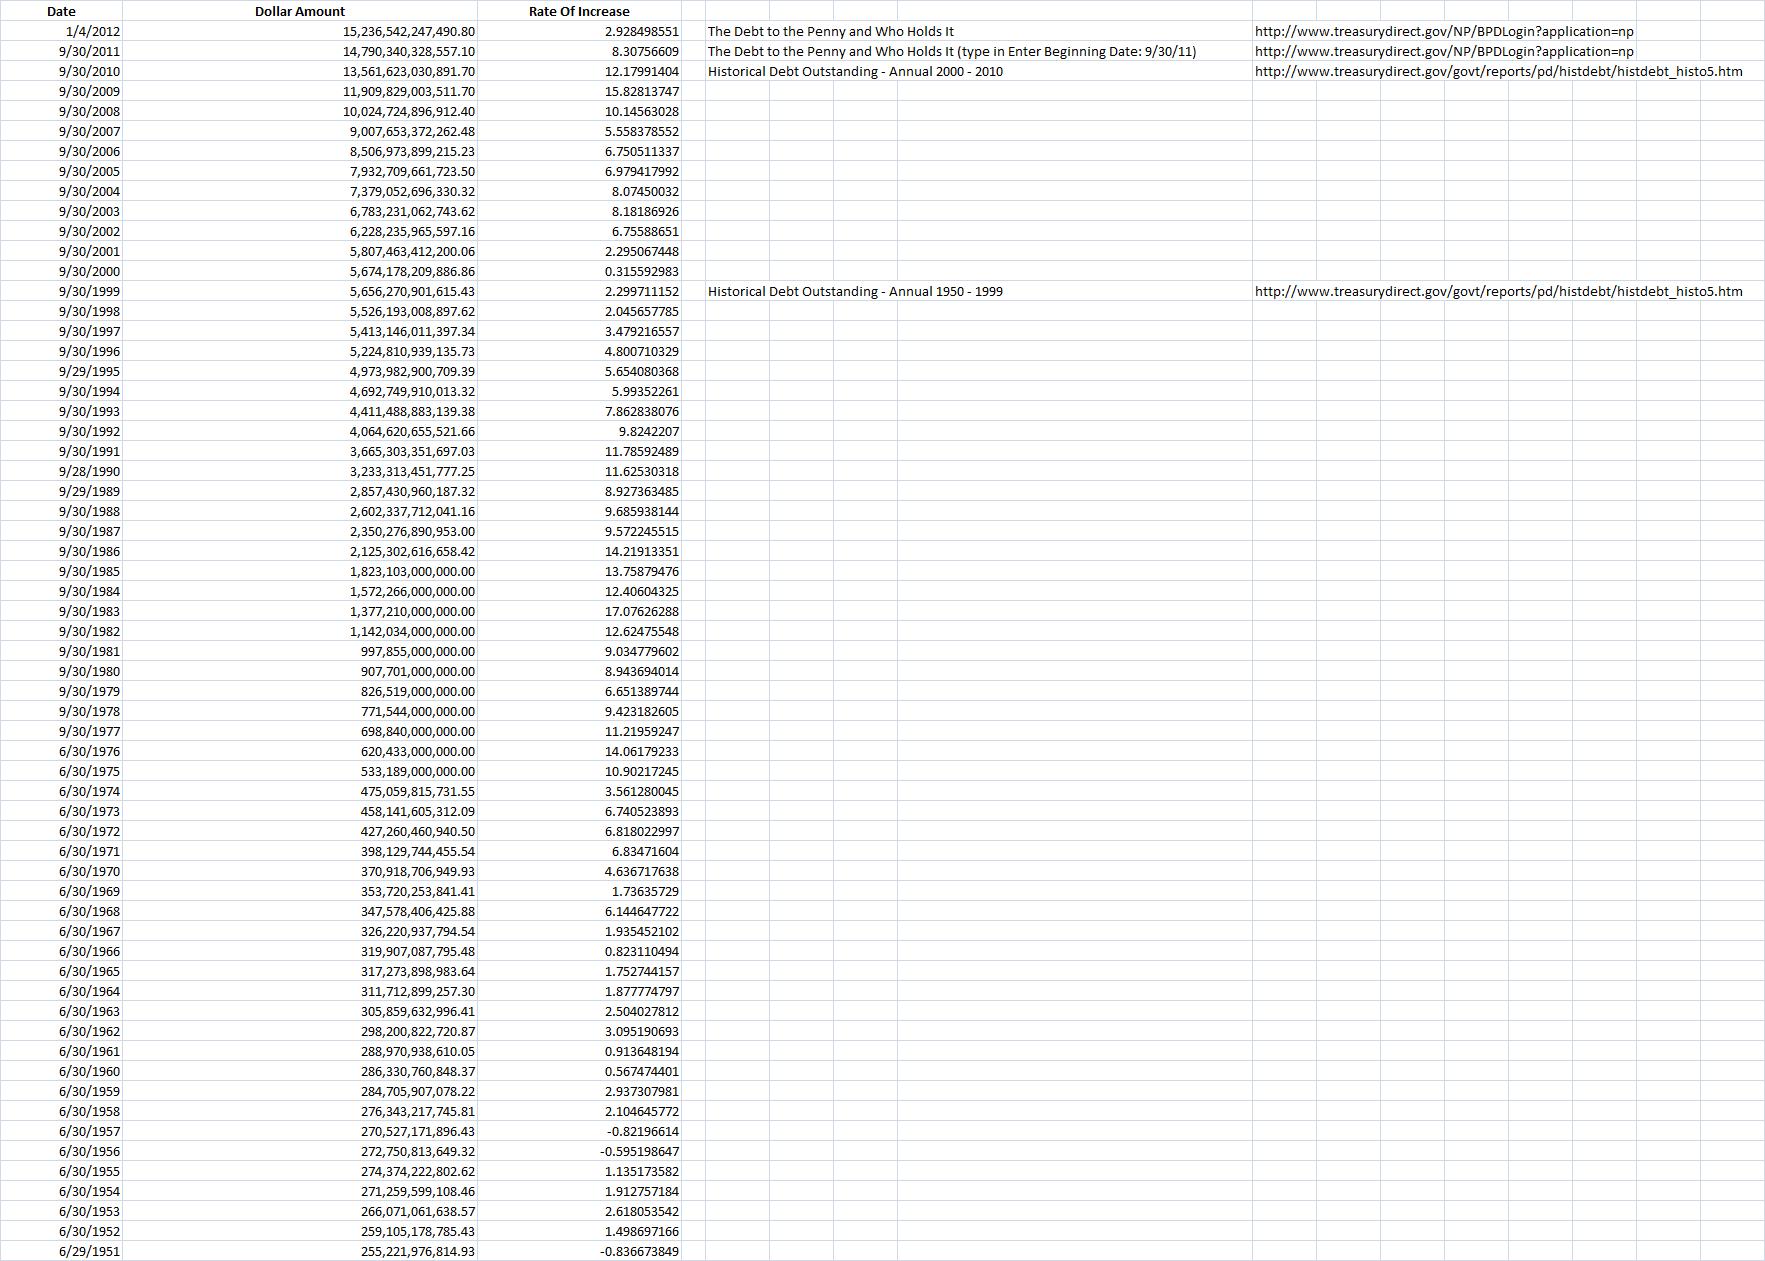
Here is the data and links to the Treasury Department to verify the numbers…
The links shown above are:
Historical Debt Outstanding – Annual 2000 – 2010
Historical Debt Outstanding – Annual 1950 – 1999
The Debt to the Penny and Who Holds It
Debt Position and Activity Report
The Debt to the Penny and Who Holds It (type in Enter Beginning Date: 9/30/11)
Check for yourself…
From January 20, 2001 to January 20, 2009 the national debt increased from $5,727,776,738,304.64 to $10,626,877,048,913.08. For those that still believe in arithmetic this is an 85% increase in the debt over the Bush administration’s term ((10,626,877,048,913.08 / 5,727,776,738,304.64) * 100) = 185% or an 85% increase).
From January 20, 2009 to January 5, 2012 the national debt increased from $10,626,877,048,913.08 to $15,236,541,899,973.10. This is a 43% increase in debt over President Obama’s term ((15,236,541,899,973.10 / 10,626,877,048,913.08) * 100) = 143% or a 43% increase).
Don’t take my word for it, check it out on the US Treasury Department site at:
http://www.treasurydirect.gov/NP/BPDLogin?application=np
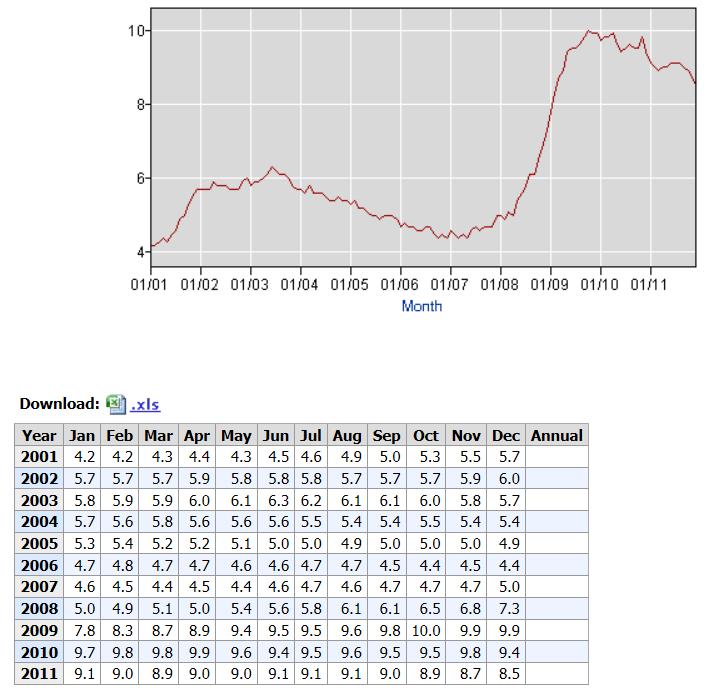
When Bush took office on January 20, 2001, the national unemployment rate was 4.2%. When he left office on January 20, 2009 and President Obama took office the national unemployment rate was 7.8%
http://www.bls.gov/cps/prev_yrs.htm
The current unemployment rate as of January 6, 2012 is 8.5%
http://www.bls.gov/news.release/empsit.nr0.htm
Doing the math, the increase during the Bush administration was (7.8 / 4.2) * 100 = 186% or a 86% increase in unemployment. For the Obama administration the math is (8.5 / 7.8) * 100 = 109% or a 9% increase in unemployment.
* Note: I have revised this based the January, 2009 unemployment number of 7.8%. Preseident Obama took office January, 20, 2009. From the graph below you can see that the unemployment rate exploded just as he got into office. I think this explosion arguably was not due to anything President Obama did in his first few months (just 4 months later the rate was 9.4%) as the national unemployment rate does not turn on the dime but I will give the detractors the benefit of the doubt. There is still a huge difference in 86% (Bush) and 9% (Obama). If the numbers from 4 months after President Obama took office are used they work out to:
Bush administration increase in unemployment: 124%
Obama administration decrease in unemployment: 10%
Transition Date: End of May, 2009
Given this, the difference would be a 134% increase in unemployment during the Bush administration over the Obama administration. I would love it of someone could explain to me how this is an indictment of the Democrats? Doesn’t this clearly show that the Democrats are doing something right and the Bush administration did something wrong? Why are we suppose to believe that this is something peculiar to the Bush Presidency and not endemic to the ideology of Republicanism that ALREADY is back to the rhetoric of deregulation?


