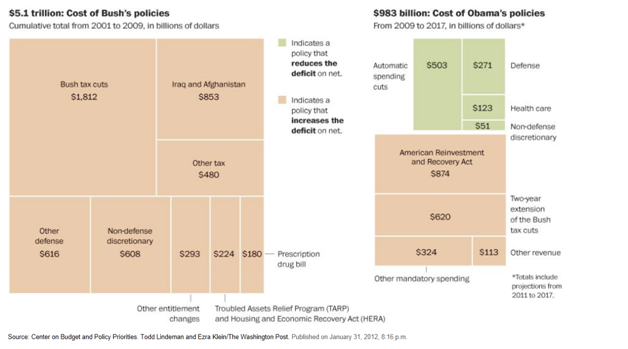
This article is a factual examination of the historical causes for the economic collapse that began in 2006.
Here are some obvious facts about the economic crisis:
It occurred in 2006. President Bush had been president for six years. The Republicans had controlled both the Senate and the House for six years.
The last four years of the Clinton administration there was an annual budget surplus. The last time this occurred was in 1969.[i] It has not happened since. To be fair, the Republicans took control of the House of Representatives in 1994.
Certainly, a significant event that started the collapse happened during the last few years of the Clinton administration. The Gramm–Leach–Bliley Act of 1999, known as financial services deregulation,
repealed part of the Glass-Steagall Act of 1933, opening up the market among banking companies, securities companies and insurance companies. The Glass-Steagall Act prohibited any one institution from acting as any combination of an investment bank, a commercial bank, and an insurance company.[ii]
The bill was a compromise between the Clinton Administration and the House Republicans:
The bill then moved to a joint conference committee to work out the differences between the Senate and House versions. Democrats agreed to support the bill after Republicans agreed to strengthen provisions of the anti-redlining Community Reinvestment Act and address certain privacy concerns; the conference committee then finished its work by the beginning of November. On November 4, the final bill resolving the differences was passed by the Senate 90-8, and by the House 362-57. This legislation was signed into law by Democratic President William Jefferson “Bill” Clinton on November 12, 1999.[iii]
The law allowed the traditional investment brokers to create and sell High Risk Investment Products to traditionally Low Rise Investment Banks that led to sub-prime mortgage fiasco and Hedge Fund meltdown of 2007. Historically, the combined industry has been known as the “financial services industry”.[iv]
This post will document, reference and detail how the mortgage meltdown occurred.
This is what the data will show:
- The increase of low income housing, sub-prime loans in the Clinton and Bush administration were NOT the prime factor in the economic crisis although they did contribute in a small way.
- A large ramp up in purchasing of Mortgage Backed Securities (MBS) under pressure from the Bush administration to meet the 56% low income housing requirement of President Bush contributed more significantly to the collapse.
- The market demand created by the MBS in the private sector for 30 trillion dollars of unregulated, credit default swaps was the final and most significant factor in the mortgage meltdown.
In 2008 a Washington Post article stated,
In 1995, President Bill Clinton’s HUD agreed to let Fannie and Freddie get affordable-housing credit for buying subprime securities that included loans to low-income borrowers. The idea was that subprime lending benefited many borrowers who did not qualify for conventional loans. HUD expected that Freddie and Fannie would impose their high lending standards on subprime lenders. Banks typically back prime loans with customers’ deposits. But subprime lenders often rely on money from Wall Street investors , who buy packages of loans as investments called mortgage-backed securities.[v]
Many folks quote this article but here is the history that proceeded President Clinton’s action:
Conventional loans are low risk. Sub-prime loans are higher risk, non-conventional loans.
How did non-conventional, sub-prime loans get started[vi]?
Fair Housing Act[vii] of 1968 – President Lyndon B. Johnson
It was a follow-up to the Civil Rights Act of 1964. While the Civil Rights Act of 1866 prohibited discrimination in housing, there were no federal enforcement provisions.
[viii] of 1974 – President Gerald Ford
It made it unlawful for any creditor to discriminate against any applicant, with respect to any aspect of a credit transaction, on the basis of race, color, religion, national origin, sex, marital status, or age.
Home Mortgage Disclosure Act[ix] of 1975 (HMDA) – President Gerald Ford
It requires financial institutions to maintain and annually disclose data about home purchases, home purchase pre-approvals, home improvement, and refinance applications involving 1 to 4 unit and multifamily dwellings. It also requires branches and loan centers to display a HMDA poster.
HMDA was designed by the Federal Reserve Board in order to:
Help public officials to distribute public-sector investments
Discover if financial institutions are serving housing needs of communities
Identify where there are discriminatory lending practices
Community Reinvestment Act of 1975[x] – President Jimmy Carter
It was designed to encourage commercial banks and savings associations to meet the needs of borrowers in all segments of their communities, including low- and moderate-income neighborhoods. Congress passed the Act in 1977 to reduce discriminatory credit practices against low-income neighborhoods, a practice known as redlining.
The Questionable Authority is a blog that explains redlining well,
Let’s start with the Community Reinvestment Act and the reasons that it was passed. For decades prior to the law’s passage, banks engaged in a process known as redlining, where they declined to write loans in certain geographic areas – typically low-income areas with large minority populations. They did not decline to write bad loans in these areas; they refused to write any loans at all. For example, in 1975 the largest bank in the Bronx wrote a grand total of 32 loans in the entire borough (Rooney 1995, p.50). No loans means no new businesses, no new housing, no opportunity. [xi]
Here is a historical chart based on The American Institute of Policy Research and the Government Accounting Office.[xii] [xiii] The columns are:
the total sub-prime loans as a percentage of all loan originations (Col 1). The total includes Government Sponsored Enterprises (GSEs are Freddie, Fannie and FHA) and private mortgage companies. Freddie and Fannie are not government agencies.
the percent of GSE sub-prime loans (Col 2). For example, 1997 the GSE sub-prime loans were 51% of the total originations of 19%.
the total in billions of all of all loan originations (Col 3).
the total in billions of all sub-prime loans (Col 4) including private sector, GSE and FHA.
the total in billions of sub-prime, GSE and FHA loans (Col 5).
the percent of the total market of GSE and FHA, sub-prime loans (Col 6)
the default percentage of the total market (Col 7)
the amount in billions of the total market defaults (Col 8 )
Note: All currency amounts in billions
Year Col 1 Col 2 Col 3 Col 4 Col 5 Col 6 Col 7 Col 8
1997 19% 51% $926 $176 $90 10% 0.9% $8
1999 22% 61% $1050 $231 $141 13% 0.9% $12
2001 19% 65% $1437 $273 $177 12% 0.7% $17
2003 17% 67% $1765 $300 $201 11% 0.6% $21
2005 26% 43% $1042 $271 $117 11% 1.5% $9
2007 18% 70% $2033 $366 $256 13% 0.5% $28
Column 1 show that, for the years shown, all private sector and public sector sub-prime loans which includes low income loans peaked in 2005 at 26%.
Column 2 shows that, for the years shown, all
The American Institute of Policy Research further states,
Subprime Loans as a percentage of total originations were fairly constant for the period 1997-2003, averaging about 19.5%. The percentage averaged 26% for 2004-2006, before declining to 18% in 2007.[xiv]
Conclusion:
Non-conforming, sub-prime loans were a small percentage of all mortgage originations.
Fannie, Freddie and FHA were an even smaller percentage of all sub-prime loans.
Defaults on all mortgages were even smaller
In 1997, two years after the Clinton and HUD issue, GSE and FHA sub-prime loans represented about 10% of the total market. Even in the Bush administration this only grew 13%.
This is a historical chart based on a paper presented to the Financial Crisis Inquiry Commission.[xv] The columns are:
GSE new mortgage business as a percentage of total single family mortgage originations (Col 1)
FHA new mortgage business as a percentage of total single family mortgage originations (Col 2)
Private, sub-prime new mortgage business as a percentage of total single family mortgage originations (Col 3)
Private, high risk (stated income, etc.) new mortgage business as a percentage of total single family mortgage originations (Col 4). High risk was not tracked until 2002.
Year Col 1 Col 2 Col 3 Col 4
1997 32% 9% 14% NA
1999 42% 9% 12% NA
2001 44% 6% 9% NA
2003 51% 4% 10% 21%
2005 30% 2% 32% 42%
2007 30% 2% 34% 45%
The report further states,
It thus appears that the subprime lending innovations over this period actively displaced GSE and FHA activity, leading to the declines in their market shares. [xvi]
Conclusion: From 2003 to 2006 GSEs and FHA new market share went down significantly while private mortgage company’s market share on sub-prime, high risk loans went up significantly.
MBS are packages of mortgages (sort of like mutual funds) that are bought and sold on in the stock market. They are mortgages bought from private companies and bundled into packages by huge trading firms (you know the ones we bailed out) and sold on the stock exchange.
In 1997 the GSEs owned about 12% of the total market share of these securities. In 2001 the GSEs owned about 15% of the total market share of these securities. In 2008 this percentage had grown dramatically to 40%.
In intervening years it was much more. President Bush directed his HUD director to pressure the GSEs into buying massive amounts these MBS on the open market. This created huge market for these securities and encouraged more and more risky private sector mortgages so they could be bought, bundled and sold on the open market largely to Fannie and Freddie.
As the Washington Post article states,
But by 2004, when HUD next revised the goals, Freddie and Fannie’s purchases of subprime-backed securities had risen tenfold. Foreclosure rates also were rising.
That year, President Bush’s HUD ratcheted up the main affordable-housing goal over the next four years, from 50 percent to 56 percent. John C. Weicher, then an assistant HUD secretary, said the institutions lagged behind even the private market and “must do more.”
For Wall Street, high profits could be made from securities backed by subprime loans. Fannie and Freddie targeted the least-risky loans. Still, their purchases provided more cash for a larger subprime market.
“That was a huge, huge mistake,” said Patricia McCoy, who teaches securities law at the University of Connecticut. “That just pumped more capital into a very unregulated market that has turned out to be a disaster.”[xvii]
How did the GSE’s accomplish this? As the article further states:
In 2003, the two bought $81 billion in subprime securities. In 2004, they purchased $175 billion — 44 percent of the market. In 2005, they bought $169 billion, or 33 percent. In 2006, they cut back to $90 billion, or 20 percent. Generally, Freddie purchased more than Fannie and relied more heavily on the securities to meet goals.
“The market knew we needed those loans,” said Sharon McHale, a spokeswoman for Freddie Mac. The higher goals “forced us to go into that market to serve the targeted populations that HUD wanted us to serve,” she said.
But because Fannie and Freddie were buying mortgage-backed securities rather than the actual subprime loans, their involvement came too late to require stiffer standards from lenders.
Fannie and Freddie “made no progress in civilizing the market,” said Sandra Fostek, a senior regulator at HUD.
William C. Apgar Jr., who was an assistant HUD secretary under Clinton, said he regrets allowing the companies to count subprime securities as affordable.
“It was a mistake,” he said. “In hindsight, I would have done it differently.”[xviii]
Conclusion: Even though Fannie, Freddie and FHA had much less to do with new loans in the Bush administration they bought huge amounts of MBS in those years to meet President Bush’s 56% housing requirement.
Additionally, the President encouraged the GSEs to “focus” their “core housing mission” “with respect to low-income Americans and first-time homebuyers” in the following statement from the White House,
The Administration strongly believes that the housing GSEs should be focused on their core housing mission, particularly with respect to low-income Americans and first-time homebuyers. Instead, provisions of H.R. 1461 that expand mortgage purchasing authority would lessen the housing GSEs’ commitment to low-income homebuyers.[xix]
Conclusion: President Bush had directed HUD to require the GSEs to meet the 56% low income housing requirement. This pressured the GSEs to buy massive MBS. This created a massive market for junk mortgages.
Credit Default Swaps are insurance policies on mortgages, sort of like the futures market for commodities for MBS. Credit Default Swaps are not regulated. The government did not own credit default swaps. This was purely a private market commodity.
Between 2000 and 2008, the market for such swaps ballooned from $900 billion to more than $30 trillion.[xx]
This is what brought AIG down.
Goldman Sachs played both sides MBS and Credit Default Swaps.
When the Fannie and Freddie bought huge amounts of MBS, pressured by the Bush administration, the market for credit default swaps went astronomical. This is ultimately what broke them and resulted in tax payers having to bail them out. [xxi]
If you do not believe me what about Greenspan, Treasury Secretary Paul O’Neill, Securities and Exchange Commission chairman Harvey Pitt, and Commodity Futures Trading Commission chairman James Newsome,
In September 2002, Greenspan, Treasury Secretary Paul O’Neill, Securities and Exchange Commission chairman Harvey Pitt, and Commodity Futures Trading Commission chairman James Newsome wrote a letter to members of Congress to note their opposition to legislation that would regulate derivatives. They wrote:
We believe that the [over-the-counter] derivatives markets in question have been a major contributor to our economy’s ability to respond to the stresses and challenges of the last two years. This proposal would limit this contribution, thereby increasing the vulnerability of our economy to potential future stresses….
We do not believe a public policy case exists to justify this governmental intervention. The OTC markets trade a wide variety of instruments. Many of these are idiosyncratic in nature….
While the derivatives markets may seem far removed from the interests and concerns of consumers, the efficiency gains that these markets have fostered are enormously important to consumers and to our economy.
Greenspan and the others urged Congress “to be aware of the potential unintended consequences” of legislation to regulate derivatives.
They got it exactly wrong. Swaps and derivatives ended up undermining, not bolstering, the economy.[xxii]
This data clearly shows that:
The increase of low income, sub-prime loans and the low overall default rate of all loan originations (1.5% in 2005 was the highest tracked in this data, through 2007). This dispels that myth that the crisis was caused by loan defaults of low-income folks.
The huge increase of MBS purchased by the GSEs from 2003 through 2006 under pressure from the Bush administration to meet the 56% affordable housing requirement along with the 30 trillion dollar credit default swap fault market it created in the private sector was the cause of the housing bubble that burst into the subsequent economic crisis. Even Alan Greenspan, a Republican, admitted in his interview Brian Naylor,
BRIAN NAYLOR: The man once known as the maestro for his direction of the nation’s economy as Fed chairman sat for four long hours yesterday, watching lawmakers who once cheered his performances turn into harsh critics. Testifying before the House Oversight Committee, Greenspan didn’t down play the severity of the crisis in the nation’s markets.
Mr. ALAN GREENSPAN (Former Chairman, Federal Reserve): We are in the midst of a once-in-a-century credit tsunami. Central banks and governments are being required to take unprecedented measures.
NAYLOR: Under questioning from Democrats on the panel, Greenspan conceded he might have been, as he put it, partially wrong in not moving to regulate trading of some derivatives that are among the root causes of the credit crisis. He also admitted his free market ideology may be flawed. This exchange with committee chairman, Democrat Henry Waxman of California, verged on the metaphysical.
Representative HENRY WAXMAN (Committee Chairman, Democrat, 30th District of California): You found a flaw in the reality…
Mr. GREENSPAN: Flaw in the model that I perceived is a critical functioning structure that defines how the world works, so to speak.
Rep. WAXMAN: In other words, you found that your view of the world, your ideology was not right. It was not working.
Mr. GREENSPAN: How it – precisely. That’s precisely the reason I was shocked, because I’ve been going for 40 years or more with very considerable evidence that it was working exceptionally well.[xxiii]
This is what happens when the private sector and government work in collusion with each other. Between the Democrats and the Republican’s who do you suppose would have the explicit, stated purpose of doing that? Hint: Who wants to privatize Social Security[xxiv] and Medicare? Who do you think is going to pay for it?
[i]Revenues, Outlays, Deficits, Surpluses, and Debt Held by the Public,
1968 to 2007, in Billions of Dollars
Sources: Congressional Budget Office; Office of Management and Budget.
Date Deficit (-) or Surplus Debt Held by the Public
1968 -25.2 289.5
1969 3.2 278.1
1970 -2.8 283.2
1971 -23.0 303.0
1972 -23.4 322.4
1973 -14.9 340.9
1974 -6.1 343.7
1975 -53.2 394.7
1976 -73.7 477.4
1977 -53.7 549.1
1978 -59.2 607.1
1979 -40.7 640.3
1980 -73.8 711.9
1981 -79.0 789.4
1982 -128.0 924.6
1983 -207.8 1,137.3
1984 -185.4 1,307.0
1985 -212.3 1,507.3
1986 -221.2 1,740.6
1987 -149.7 1,889.8
1988 -155.2 2,051.6
1989 -152.6 2,190.7
1990 -221.0 2,411.6
1991 -269.2 2,689.0
1992 -290.3 2,999.7
1993 -255.1 3,248.4
1994 -203.2 3,433.1
1995 -164.0 3,604.4
1996 -107.4 3,734.1
1997 -21.9 3,772.3
1998 69.3 3,721.1
1999 125.6 3,632.4
2000 236.2 3,409.8
2001 128.2 3,319.6
2002 -157.8 3,540.4
2003 -377.6 3,913.4
2004 -412.7 4,295.5
2005 -318.3 4,592.2
2006 -248.2 4,829.0
2007 -160.7 5,035.1
http://www.cbo.gov/budget/data/historical.pdf
[ii]Gramm–Leach–Bliley Act
http://en.wikipedia.org/wiki/Gramm-Leach-Bliley_Act
[iii]Gramm–Leach–Bliley Act
http://en.wikipedia.org/wiki/Gramm-Leach-Bliley_Act
[iv]Gramm–Leach–Bliley Act
http://en.wikipedia.org/wiki/Gramm-Leach-Bliley_Act
[v]How HUD Mortgage Policy Fed The Crisis
http://www.washingtonpost.com/wp-dyn/content/article/2008/06/09/AR2008060902626.html
[vi] Community Reinvestment Act
http://en.wikipedia.org/wiki/Community_Reinvestment_Act
[vii]FAIR HOUSING ACT
http://www.justice.gov/crt/housing/title8.php
[viii]US Code, 15 U.S.C. § 1691
http://www.law.cornell.edu/uscode/15/1691.html
[ix] Home Mortgage Disclosure Act of 1975
http://www.fdic.gov/regulations/laws/rules/6500-3030.html#6500hmda1975
[x] Community Reinvestment Act
http://www.fdic.gov/regulations/laws/rules/6500-2515.html#6500hcda1977
[xi]http://scienceblogs.com/authority/2008/09/the_subprime_mortgage_crisis_a.php
[xii]Table 3: Detail for Subprime Loans – see endnotes for sources (page 10 pdf)
http://www.aei.org/docLib/Pinto-High-LTV-Subprime-Alt-A.pdf
Figure 1: GSE Investment Portfolio and MBS ($ Billions, Left Axis),
GSE % of Total Outstanding Single Family Mortgages (Right Axis)
http://www.fcic.gov/hearings/pdfs/2010-0227-Jaffee.pdf
[xiii] GAO report (page 18 for sub-prime data and page 21 for default rates data in pdf):
http://www.mortgagebankers.org/files/News/InternalResource/57640_GAOReportInformationonRecentDefaultandForeclosureTrends.pdf
[xiv]http://www.aei.org/docLib/Pinto-High-LTV-Subprime-Alt-A.pdf (page 12 pdf)
[xv]Figure 1: GSE Investment Portfolio and MBS ($ Billions, Left Axis),
GSE % of Total Outstanding Single Family Mortgages (Right Axis)
http://www.fcic.gov/hearings/pdfs/2010-0227-Jaffee.pdf
[xvi]Figure 2: GSE, FHA, Subprime, and High Risk New Mortgage Activity as Percentage of Total Single‐Family Mortgage Originations (page 9 pdf)
http://www.fcic.gov/hearings/pdfs/2010-0227-Jaffee.pdf
[xvii]How HUD Mortgage Policy Fed The Crisis
http://www.washingtonpost.com/wp-dyn/content/article/2008/06/09/AR2008060902626.html
[xviii]How HUD Mortgage Policy Fed The Crisis
http://www.washingtonpost.com/wp-dyn/content/article/2008/06/09/AR2008060902626.html
[xix]Statement from the White House (President Bush) October 26, 2005:
http://georgewbush-whitehouse.archives.gov/omb/legislative/sap/109-1/hr1461sap-h.pdf
http://topics.nytimes.com/top/reference/timestopics/subjects/c/credit_default_swaps/index.html?inline=nyt-classifier
[xxi]Interesting Article
http://money.cnn.com/magazines/fortune/fortune_archive/2005/01/24/8234040/index.htm
See also,
http://www.nytimes.com/2005/08/29/opinion/29krugman.html
http://blogs.reuters.com/felix-salmon/2010/05/03/did-greenspan-try-to-quash-a-housing-bubble-debate/
[xxii]http://motherjones.com/politics/2008/10/alan-shrugged
[xxiii]http://www.npr.org/templates/story/story.php?storyId=96070766
[xxiv]To those that say they could invest their Social Security dollars I can tell you as an active trader that even professionals rarely do better than market. I wouldn’t mind if the Congress did allow folks to do their own investing but it is sort of like people that do not have health insurance…when they do need medical care they end up in the emergency room and cost all of us more money. However, if we could figure out a way for people that invested their own Social Security dollars and lost it all to keep from ending up on the taxpayer’s bill I would have no problem with it. It is true that the Bush Administration was only pushing for a lower percentage of Social Security dollars that could be invested privately but this debate goes back many decades to the beginning of Social Security. The Republicans since FDR would like to get rid of or never have had Social Security. Since they have failed to get rid of it in previous decades their current effort is to make a fundamental change to the trust fund (which can only be done through a very difficult act of Congress) to allow a small percentage of individual investment. If they could accomplish this subsequently increasing the allowed percentage would be a much easier Congressional task.
Here are more references for the Republican attempts to privatize Social Security in this decade:
Assorted articles concerning Republican’s plans to privatize Social Security:
Republican Privatization to Eliminate Medicare and Social Security
What are Republicans trying to privatize Social Security?
Social Security Privatization
Pelosi blasts Republican plan to privatize Social Security
National Review: Social Security Privatization a Winning Issue
Social Security Still Needs to Be Privatized
Social Security
Republican bills aimed at privatization:
Report: “Social Security Reform: Current Issues and Legislation,” By Dawn Nuschler. Congressional Research Service, Library of Congress. Updated May 18, 2007.http://www.house.gov/waxman/pdfs/crs/RL33544.pdf
Page CRS-18:
In the 109th Congress, 10 Social Security reform bills were introduced as follows: H.R. 440 (Representative Kolbe and Representative Boyd), H.R. 530 (Representative Sam Johnson), H.R. 750 (Representative Shaw), S. 540 (Senator Hagel), S. 857 (Senator Sununu), H.R. 1776 (Representative Paul Ryan), H.R. 2472 (Representative Wexler), S. 1302 (Senator DeMint), H.R. 3304 (Representative McCrery), and S. 2427 (Senator Bennett). All but two of the measures (H.R. 2472 and S. 2427) would have established individual accounts to supplement or replace traditional Social Security benefits, among other changes.
Report: “Social Security: The Chilean Approach to Retirement.” By Christopher Tamborini. Congressional Research Service, Library of Congress, May 17, 2007. http://assets.opencrs.com/rpts/RL34006_20070517.pdf
Page CRS-3: “During the 109th Congress, 10 Social Security reform bills were introduced; all but two of these would have allowed workers to invest some part of their earnings in individual retirement accounts, either to supplement the Social Security system (often referred to as add-on accounts) or to replace part of the system (often referred to as carve-out accounts).13 No legislation received congressional action.”
Report: “Social Security Reform: Current Issues and Legislation,” By Dawn Nuschler. Congressional Research Service, Library of Congress. Updated May 18, 2007. http://www.house.gov/waxman/pdfs/crs/RL33544.pdf
Page CRS-18: “In the 109th Congress, 10 Social Security reform bills were introduced as follows: H.R. 440 (Representative Kolbe and Representative Boyd), H.R. 530 (Representative Sam Johnson), H.R. 750 (Representative Shaw), S. 540 (Senator Hagel), S. 857 (Senator Sununu), H.R. 1776 (Representative Paul Ryan), H.R. 2472 (Representative Wexler), S. 1302 (Senator DeMint), H.R. 3304 (Representative McCrery), and S. 2427 (Senator Bennett).”
Web page: “Biographical Directory of the United States Congress 1774-Present.” United States Congress. Accessed September 17, 2008 at http://bioguide.congress.gov/biosearch/biosearch.asp
{This site was used to determine the party affiliations of the sponsors of the following bills:}
H.R. 440 – Representative Kolbe (R-AZ) and Representative Boyd (D-FL)
H.R. 530 – Representative Sam Johnson (R-TX)
H.R. 750 – Representative Shaw (R-FL)
S. 540 – Senator Hagel (R-NE)
S. 857 – Senator Sununu (R-NH),
H.R. 1776 – Representative Paul Ryan (R-WI)
S. 1302 – Senator DeMint (R-SC)
H.R. 3304 – Representative McCrery (R-LA)
Report: “Social Security Reform: Current Issues and Legislation,” By Dawn Nuschler. Congressional Research Service, Library of Congress. Updated May 18, 2007. http://www.house.gov/waxman/pdfs/crs/RL33544.pdf
Page CRS-23:
During the 110th Congress, two comprehensive Social Security reform measures have been introduced: H.R. 1090 (Social Security Guarantee Plus Act of 2007) and H.R. 2002 (Individual Social Security Investment Program Act of 2007). H.R. 1090, which is the same as H.R. 750 in the 109th Congress, would establish voluntary individual accounts funded with general revenues, among other program changes. H.R. 2002, which is the same as H.R. 530 in the 109th Congress, would establish individual accounts funded with a redirection of current payroll taxes, among other program changes.
{H.R. 1090 was sponsored by Rep. Ron Lews (R-KY). H.R. 2002 was sponsored by Rep. Samuel Johnson (R-TX).}
Bill: “S.2765, Saving Social Security Act of 2008.” United States Senate, March 13, 2008. http://thomas.loc.gov/
Sec. 101. Establishment of an investment-based option for social security benefits.
Bill: “H.R.4922: Savings Account for Every American Act of 2007.” United States House of Representatives, December 19, 2007. http://thomas.loc.gov/
{This bill calls for the establishment of individual “S.A.F.E.” savings accounts through payroll deduction to be used in retirement. A S.A.F.E. account has meaning as provided for by section 222 (c) of the IRS Code of 1986.}
Bill: “H.R.1090: Social Security Guarantee Plus Act of 2007.” United States House of Representatives, February 15, 2007. http://thomas.loc.gov/
[March 13, 2007: Referred to House Subcommittee on Social Security.]
Bill: “H.R.2002: Individual Social Security Investment Program Act of 2007.” United States House of Representatives, April 23, 2007. http://thomas.loc.gov/
[April 25, 2007: Referred to House Subcommittee on Social Security.]
Bill: “S.2765: Saving Social Security Act of 2008.” United States Senate, March 13, 2008. http://thomas.loc.gov/
[March 13, 2008: Referred to Senate Committee on Finance.]
Bill: “H.R. 4922: Savings Account for Every American Act of 2007.” United States House of Representatives, December 19, 2007. http://thomas.loc.gov/
[December 19, 2007: Referred to Committee on Ways and Means and Committee on Oversight and Government Reform.]
Report: “2008 Republican Party Platform.” Republican National Committee, September 2008. http://www.gopplatform2008.com/2008Platform.pdf
Page 19: “Comprehensive reform should include the opportunity to freely choose to create your own personal investment accounts which are distinct from and supplemental to the overall Social Security system.”
Web page: “Obama ’08, Seniors and Social Security” Obama for America. Accessed November 11, 2008 at http://www.barackobama.com/issues/socialsecurity/
“In the midst of the 2005 debate over Social Security privatization, Obama gave a major speech at the National Press Club forcefully arguing against privatization. He also repeatedly voted against Republican amendments that aimed to privatize Social Security or cut benefits.”
Transcript: “The Republican Debate on Fox News Channel,” New York Times, October 21, 2007. http://www.nytimes.com/2007/10/21/us/politics/…
“And you have to go to the American people and say we don’t — we won’t raise your taxes. We need personal savings accounts, but we got to fix this system.”
Report: “Strengthening Social Security and Creating Personal Wealth for All Americans.” The President’s Commission to Strengthen Social Security, December 21, 2001. http://www.csss.gov/reports/Final_report.pdf
Page 11: “Personal accounts improve retirement security by facilitating wealth creation and providing participants with assets that they own and that can be inherited, rather than providing only claims to benefits that remain subject to political negotiation.”